SLO 101: SLIs, error budgets and burn-rate alerts that page for the right reasons
A practical first SLO with Prometheus: pick an SLI users actually feel, turn 99.9% into an error budget, write the recording rules, add multiwindow burn-rate alerts with unit tests, and agree on an error budget policy.
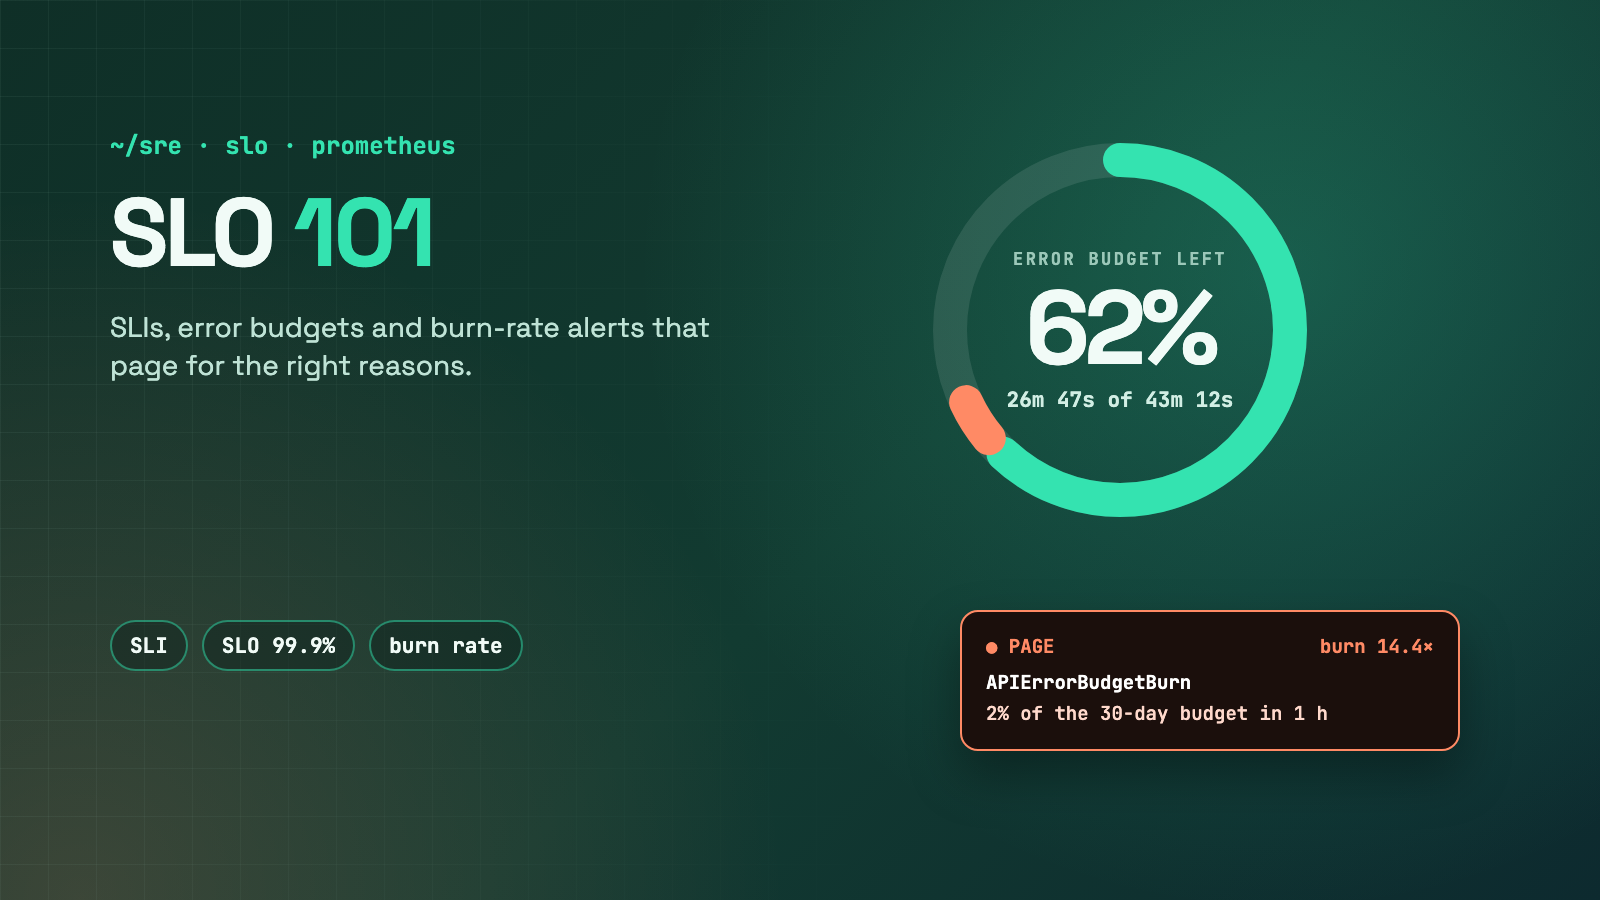
If you can’t measure how “healthy” your system is, every argument about reliability is just a feeling.
Most teams don’t lack alerts. They have too many: CPU above 80%, a pod restarted, latency spiked for 30 seconds at 3 a.m. Most of those pages don’t matter to users, and the ones that do get lost in the noise. An SLO fixes that by asking one question: are users getting the experience we promised, and how fast are we using up the room for failure?
This article builds one complete SLO for an HTTP API with Prometheus: the SLI, the error budget, the recording rules, the alerts, unit tests that prove the alerts fire when they should, and the policy that makes the number useful.
Three core concepts
| Concept | Meaning | Example |
|---|---|---|
| SLI (indicator) | A ratio of good events to all events, measured where users feel it | Share of requests that don’t return 5xx |
| SLO (objective) | A target for the SLI over a window | 99.9% over a rolling 30 days |
| Error budget | What the SLO allows to fail: 1 − SLO |
0.1% of requests ≈ 43 min of full downtime / 30 days |
The budget is the useful part. 99.9% doesn’t mean “try hard”. It means you may fail 1 request in 1,000, and everything else follows from how fast you spend that.
| SLO | Error budget | Full downtime allowed per 30 days |
|---|---|---|
| 99% | 1% | 7 h 12 min |
| 99.5% | 0.5% | 3 h 36 min |
| 99.9% | 0.1% | 43 min 12 s |
| 99.95% | 0.05% | 21 min 36 s |
| 99.99% | 0.01% | 4 min 19 s |
Don’t aim for 100%. Users can’t tell 99.99% from 100% through their own Wi-Fi and phones, and a 100% target means you can never deploy, migrate or experiment. Pick the lowest number that keeps users happy, then tighten it if they complain.
Step 1: choose SLIs users actually feel
Start with one or two SLIs per user-facing service:
- Availability: good = not a 5xx (decide whether 429 counts as bad: if users see it as an error, it does).
- Latency: good = served faster than a threshold that matters to users, e.g. 300 ms for an API. Use a percentage of requests under the threshold, not an average or a p99 gauge.
Measure as close to the user as you can: the load balancer or ingress sees errors that never reached your pods. Exclude what isn’t user traffic (health checks, internal batch jobs), or the SLO will look better than reality.
Step 2: recording rules
An alert that evaluates rate(...[3d]) on raw counters every minute is expensive and hard to read. Precompute the error ratio once per window with recording rules, named in the level:metric:operation style from the Google SRE Workbook:
groups:
  - name: slo:api:recordings
    rules:
      - record: job:slo_errors_per_request:ratio_rate5m
        expr: |
          sum by (job) (rate(http_requests_total{job="api", code=~"5.."}[5m]))
          /
          sum by (job) (rate(http_requests_total{job="api"}[5m]))
      # same rule for 30m, 1h, 2h, 6h, 1d and 3d: only the range changes
      - record: job:slo_errors_per_request:ratio_rate1h
        expr: |
          sum by (job) (rate(http_requests_total{job="api", code=~"5.."}[1h]))
          /
          sum by (job) (rate(http_requests_total{job="api"}[1h]))
      # latency SLI: share of requests faster than 300 ms
      - record: job:slo_latency_good:ratio_rate5m
        expr: |
          sum by (job) (rate(http_request_duration_seconds_bucket{job="api", le="0.3"}[5m]))
          /
          sum by (job) (rate(http_request_duration_seconds_count{job="api"}[5m]))
You need seven windows for the alerts below: 5m, 30m, 1h, 2h, 6h, 1d and 3d. The latency SLI only works if 0.3 is an actual bucket boundary in your histogram, so check your instrumentation.
Step 3: alert on burn rate, not on error rate
Burn rate is how fast you’re spending the budget compared with the “exactly on target” pace. A burn rate of 1 uses the whole budget in exactly 30 days. A burn rate of 14.4 uses it in about 2 days.
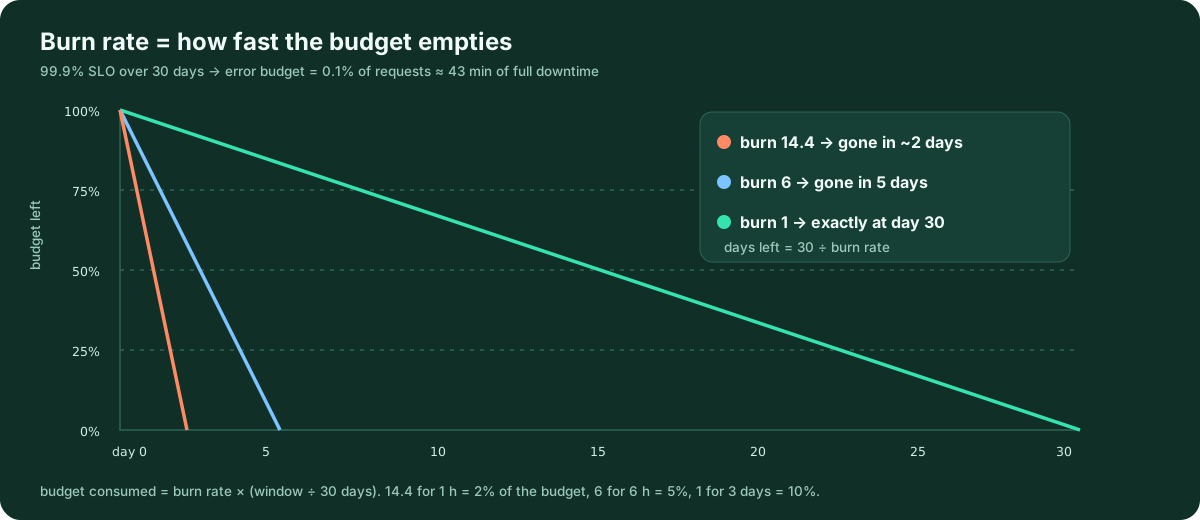
The useful formula is budget consumed = burn rate × (window ÷ 30 days). That gives the thresholds the SRE Workbook recommends as a starting point for a 99.9% SLO:
| Severity | Long window | Short window | Burn rate | Budget consumed |
|---|---|---|---|---|
| Page | 1 h | 5 min | 14.4 | 2% |
| Page | 6 h | 30 min | 6 | 5% |
| Ticket | 1 d | 2 h | 3 | 10% |
| Ticket | 3 d | 6 h | 1 | 10% |
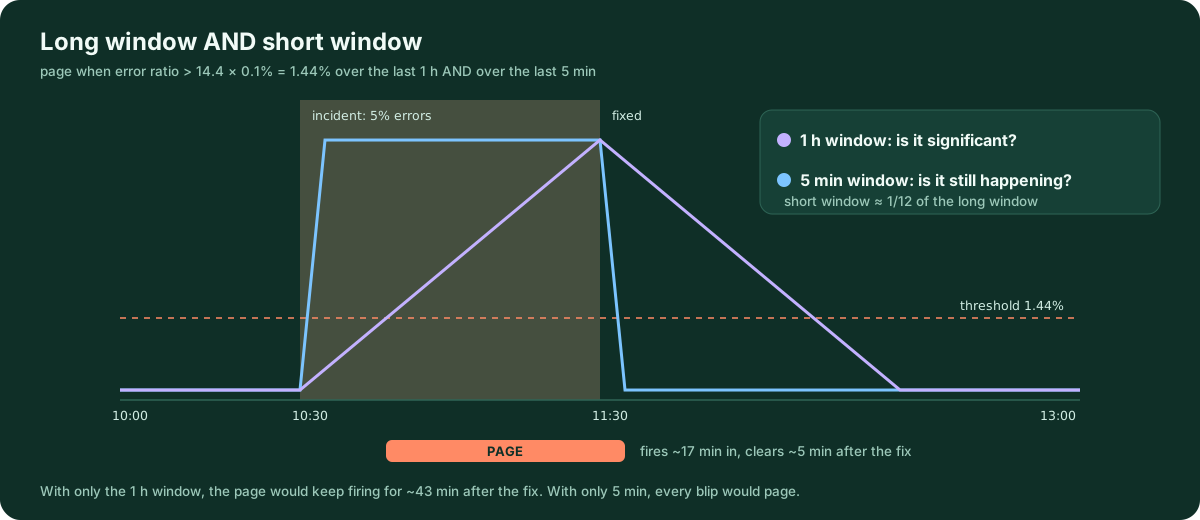
Each alert needs both windows over the threshold:
  - name: slo:api:alerts
    rules:
      - alert: APIErrorBudgetBurn
        expr: |
          (
            job:slo_errors_per_request:ratio_rate1h{job="api"} > (14.4 * 0.001)
            and
            job:slo_errors_per_request:ratio_rate5m{job="api"} > (14.4 * 0.001)
          )
          or
          (
            job:slo_errors_per_request:ratio_rate6h{job="api"} > (6 * 0.001)
            and
            job:slo_errors_per_request:ratio_rate30m{job="api"} > (6 * 0.001)
          )
        labels:
          severity: page
        annotations:
          summary: "api is burning its 30-day error budget fast (2% in 1h or 5% in 6h)"
      - alert: APIErrorBudgetBurnSlow
        expr: |
          (
            job:slo_errors_per_request:ratio_rate1d{job="api"} > (3 * 0.001)
            and
            job:slo_errors_per_request:ratio_rate2h{job="api"} > (3 * 0.001)
          )
          or
          (
            job:slo_errors_per_request:ratio_rate3d{job="api"} > 0.001
            and
            job:slo_errors_per_request:ratio_rate6h{job="api"} > 0.001
          )
        labels:
          severity: ticket
        annotations:
          summary: "api will run out of error budget before the 30-day window ends"
0.001 is the error budget (1 − 0.999). If you change the SLO, change it everywhere, or let a generator do it for you (Step 5).
Step 4: prove the alerts work with promtool
Alert rules are code, so test them. promtool test rules replays synthetic series through your rules and checks which alerts fire:
# slo-test.yml: run with `promtool test rules slo-test.yml`
rule_files: [slo-rules.yml]
evaluation_interval: 1m
tests:
  # 5% of requests fail: 50x the budget pace → page
  - interval: 1m
    input_series:
      - series: 'http_requests_total{job="api",code="200"}'
        values: '0+950x180'
      - series: 'http_requests_total{job="api",code="500"}'
        values: '0+50x180'
    alert_rule_test:
      - eval_time: 20m
        alertname: APIErrorBudgetBurn
        exp_alerts:
          - exp_labels: {job: api, severity: page}
            exp_annotations:
              summary: "api is burning its 30-day error budget fast (2% in 1h or 5% in 6h)"
  # 0.5% errors: 5x burn → ticket, but no page
  - interval: 1m
    input_series:
      - series: 'http_requests_total{job="api",code="200"}'
        values: '0+995x300'
      - series: 'http_requests_total{job="api",code="500"}'
        values: '0+5x300'
    alert_rule_test:
      - eval_time: 240m
        alertname: APIErrorBudgetBurn
        exp_alerts: []
      - eval_time: 240m
        alertname: APIErrorBudgetBurnSlow
        exp_alerts:
          - exp_labels: {job: api, severity: ticket}
            exp_annotations:
              summary: "api will run out of error budget before the 30-day window ends"
The rules and tests in this article pass promtool check rules and promtool test rules with Prometheus 3.15, including a third case not shown here: 0.05% errors, inside the SLO, fires nothing. Run the same tests in CI so nobody breaks an SLO alert with a typo.
Step 5: let a generator write the rules
Seven recording rules and two alerts per SLO is fine for one service and painful for fifty. Sloth and Pyrra generate the whole set from a short spec. With Sloth:
version: "prometheus/v1"
service: "api"
labels:
  owner: "platform-team"
slos:
  - name: "requests-availability"
    objective: 99.9
    description: "99.9% of API requests succeed over 30 days."
    sli:
      events:
        error_query: sum(rate(http_requests_total{job="api", code=~"5.."}[{{.window}}]))
        total_query: sum(rate(http_requests_total{job="api"}[{{.window}}]))
    alerting:
      name: APIHighErrorRate
      labels:
        category: "availability"
      annotations:
        summary: "api is burning its error budget"
      page_alert:
        labels:
          severity: page
      ticket_alert:
        labels:
          severity: ticket
sloth generate -i api-slo.yml -o api-rules.yml turns this into 17 rules (checked with Sloth 0.16): the SLI windows, the same multiwindow page and ticket alerts, and dashboard-ready series such as slo:period_error_budget_remaining:ratio. On Kubernetes with the Prometheus Operator, both tools can run as controllers that turn an SLO custom resource into a PrometheusRule.
For a dashboard without a generator, “budget left over the last 30 days” is:
1 - (
  sum(increase(http_requests_total{job="api", code=~"5.."}[30d]))
  /
  sum(increase(http_requests_total{job="api"}[30d]))
) / 0.001
Step 6: an error budget policy
A number nobody acts on is decoration. Write down, before the first incident, what each budget level means:
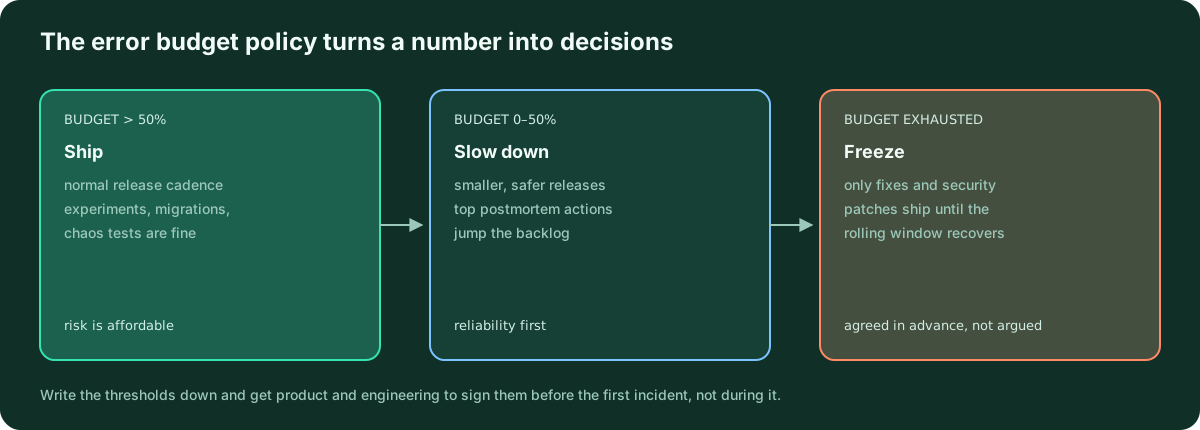
The exact thresholds matter less than having them agreed up front. Also agree on what doesn’t count against the budget, for example a provider-wide outage you can’t mitigate, and who can grant an exception.
Gotchas
- Low traffic: at 10 requests per hour, one failure is a 10% error rate and a 100× burn. Use longer windows, group small services that share a failure domain, or add synthetic probes. Don’t page on a single request.
- Rolling vs calendar windows: a rolling 30-day window recovers gradually, a calendar month resets on the 1st. Rolling is better for alerting, calendar is easier for reporting. Pick one and label dashboards clearly.
- Counter resets and missing series: if the API stops reporting entirely, the ratio has no data and no alert fires. Pair SLO alerts with an
absent()or “target down” alert. - Too many SLOs: three SLOs per service that people look at beat twenty nobody understands. Start with the critical user journeys.
- Dependencies: your SLO can’t be higher than the product of the SLOs of the things you call synchronously, unless you have retries, caches or fallbacks. Two 99.9% dependencies in series give you about 99.8%.
Checklist
- One or two SLIs per user-facing service, measured at the edge
- A target users would accept, not 100%
- Recording rules for 5m, 30m, 1h, 2h, 6h, 1d, 3d
- Multiwindow burn-rate alerts: page for fast burn, ticket for slow burn
-
promtool test rulesin CI - An absent-data alert next to every SLO alert
- An error budget policy signed by product and engineering
- A dashboard showing budget remaining, reviewed in the weekly ops meeting
Sources
- Google SRE Book: Service Level Objectives: https://sre.google/sre-book/service-level-objectives/
- Google SRE Workbook: Implementing SLOs: https://sre.google/workbook/implementing-slos/
- Google SRE Workbook: Alerting on SLOs (multiwindow burn rate): https://sre.google/workbook/alerting-on-slos/
- Prometheus recording rules: https://prometheus.io/docs/prometheus/latest/configuration/recording_rules/
- Prometheus unit testing for rules: https://prometheus.io/docs/prometheus/latest/configuration/unit_testing_rules/
- Sloth: https://github.com/slok/sloth
- Pyrra: https://github.com/pyrra-dev/pyrra
Comments