Logging on ClickHouse instead of Elasticsearch: schema, pipeline, S3 tiering and a year of retention
A practical blueprint for moving logs from Elasticsearch to ClickHouse: Vector and Kafka for ingestion, an OpenTelemetry-shaped schema with the new text index, TTL-based tiering to S3, multi-region search from one UI, and the gotchas that bite in production.
Elasticsearch is great at search. The trouble is that logs are mostly not a search problem. Logs are append-only, time-ordered, enormous and rarely read, and most of the reads are “show me errors from service X in the last 30 minutes” or “how many 5xx per minute”. You end up paying for a full inverted index on every field, JVM heap, replicas on fast disks and an ILM policy that someone has to babysit. That buys you relevance scoring nobody uses on log lines.
ClickHouse turns the problem around. It’s a columnar database, so a log table becomes a set of highly compressible columns sorted by service and time. Queries read only the columns they touch, aggregations are SQL, and old data slides onto S3 in the same table. Since ClickHouse 26.2 the full-text text index is GA, so token search on the message body is a first-class feature and no longer a workaround.
This article is the blueprint I’d use for a production migration: the pipeline, the schema, tiering to S3, multi-region search, the migration path and the gotchas.
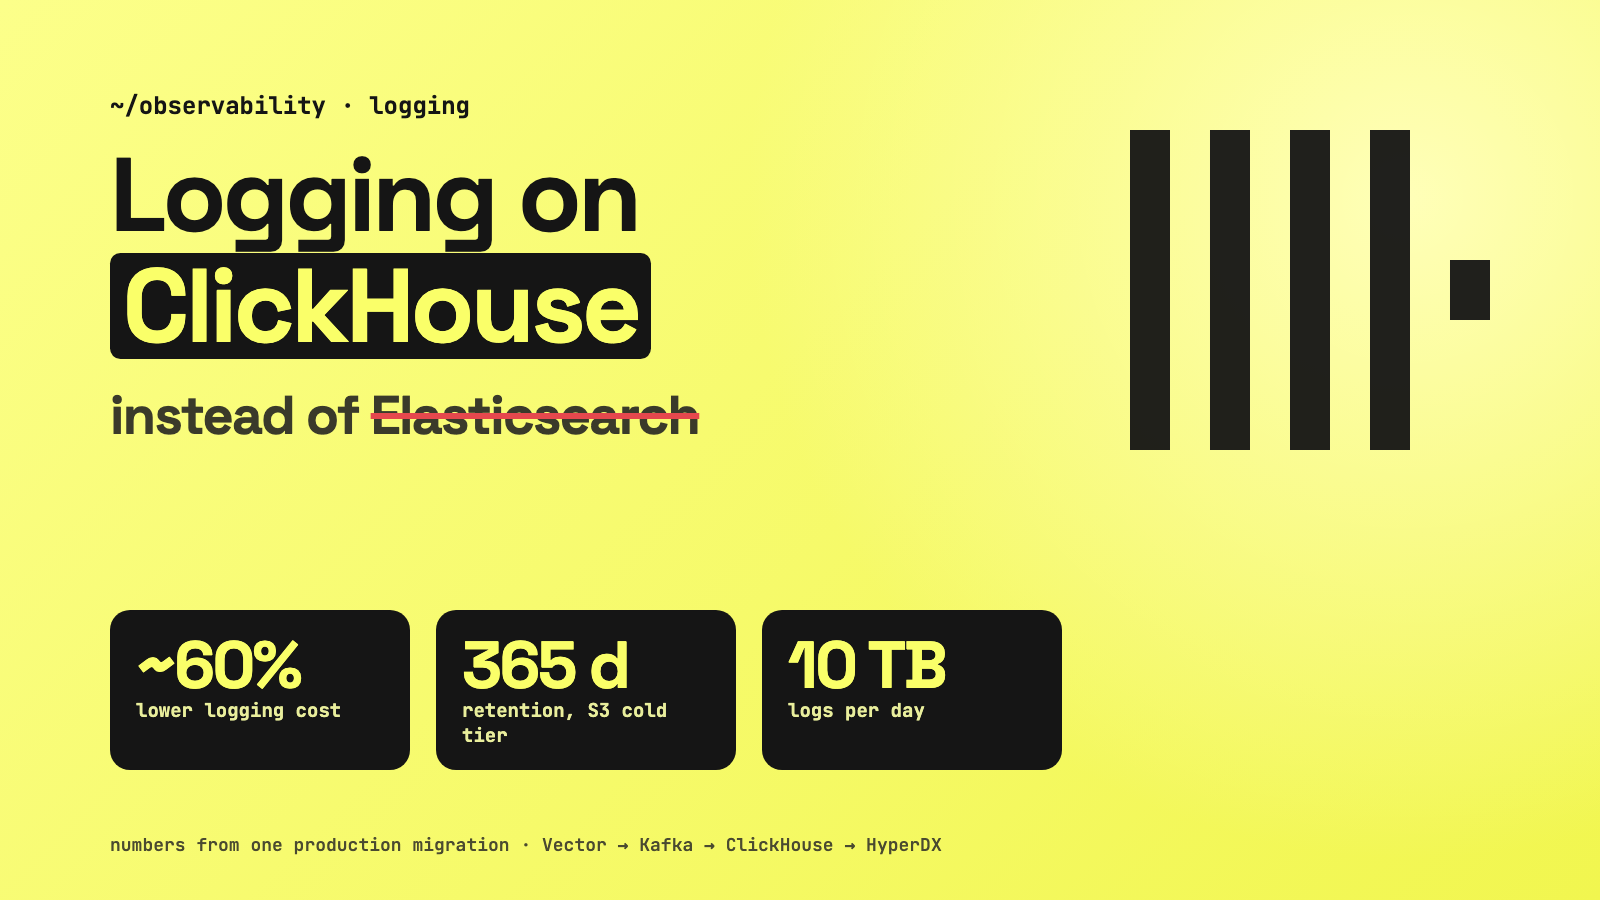
In one production migration of this shape, at roughly 10 TB/day of logs with one year of retention, total logging cost fell by about 60% compared with the Elasticsearch cluster it replaced. Your number will depend on log shape and query patterns. The mechanics below are what make that kind of saving possible.
Why logs fit a columnar store
| Elasticsearch | ClickHouse | |
|---|---|---|
| Storage model | Documents + inverted index per field + doc values + _source |
Columns sorted by ORDER BY, compressed per column |
| Typical compression for logs | Modest; indexes add to it | High: similar values sit next to each other, ZSTD and Delta codecs |
| Search | Full-text, scoring, fuzzy | Token search via text index, LIKE, regex; no scoring |
| Analytics | Aggregations DSL | Full SQL, joins, window functions |
| Retention / tiering | ILM, hot-warm-cold, searchable snapshots | Daily partitions + TTL … TO VOLUME / DELETE |
| Memory pressure | JVM heap, field data, shard count | No JVM; memory per query, controllable with settings |
To be fair, Elasticsearch has a frozen tier and searchable snapshots, and if you really need relevance ranking, fuzzy matching or “did you mean” on logs, it is still the better tool. For “filter by service, time and severity, then grep for a token, then count”, ClickHouse does the same job with far fewer bytes on disk and far less CPU.
The architecture
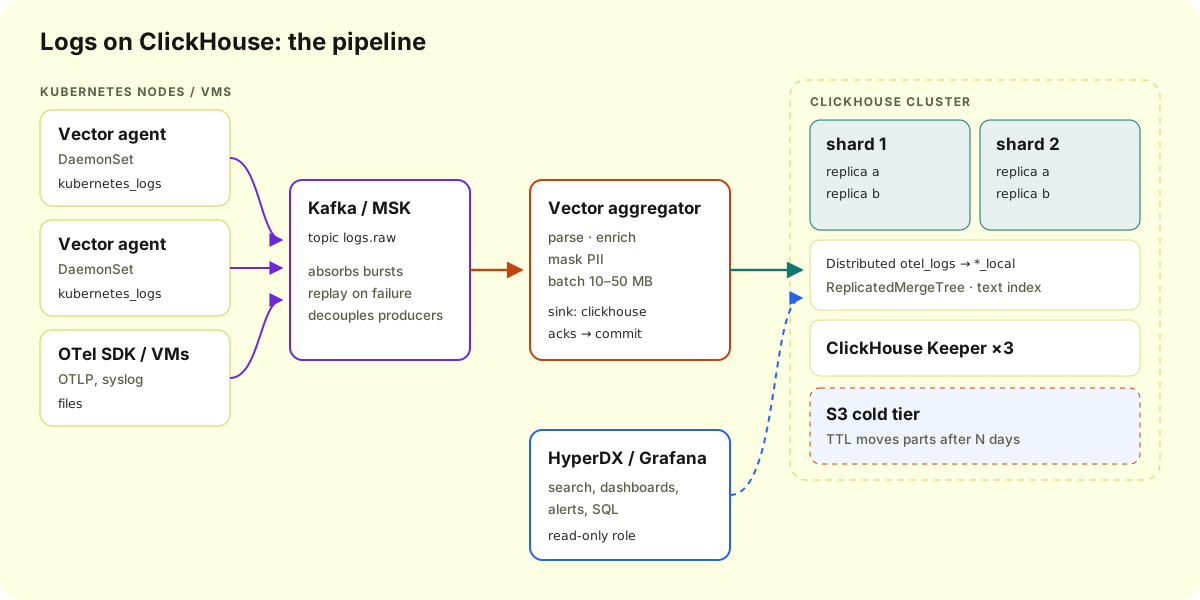
- Vector agents run as a DaemonSet (or on VMs), tail container logs and ship raw events to Kafka. They do as little as possible so a bad transform can’t take down a node.
- Kafka / MSK is the shock absorber. If ClickHouse is slow or being upgraded, logs pile up in Kafka instead of on the nodes, and you can replay a time window after a bug in the parser.
- Vector aggregators consume from Kafka, parse and enrich, mask PII, and write to ClickHouse in large batches. With end-to-end acknowledgements, Kafka offsets are only committed after ClickHouse has accepted the batch.
- ClickHouse: N shards × 2 replicas of
ReplicatedMergeTree, aDistributedtable on top, and ClickHouse Keeper (3 nodes) for replication metadata. - HyperDX (the UI in ClickStack, ClickHouse’s observability stack) or Grafana for search, dashboards and alerts. HyperDX accepts Lucene-style queries as well as SQL, and correlates logs, traces and metrics.
If you’re starting fresh and already use OpenTelemetry, ClickStack’s OTel collector can replace Vector. The schema below is the OpenTelemetry log shape either way, so you can switch later.
The schema
Most of the performance comes from the schema, so this is the part worth getting right. Here’s a local table in the OTel shape, adapted from ClickHouse’s own schema guidance:
CREATE TABLE otel.otel_logs_local ON CLUSTER logs
(
    Timestamp          DateTime64(9) CODEC(Delta(8), ZSTD(1)),
    TraceId            String CODEC(ZSTD(1)),
    SpanId             String CODEC(ZSTD(1)),
    SeverityText       LowCardinality(String) CODEC(ZSTD(1)),
    SeverityNumber     UInt8,
    ServiceName        LowCardinality(String) CODEC(ZSTD(1)),
    Body               String CODEC(ZSTD(1)),
    ResourceAttributes Map(LowCardinality(String), String) CODEC(ZSTD(1)),
    LogAttributes      Map(LowCardinality(String), String) CODEC(ZSTD(1)),

    -- hot attributes promoted to real columns
    K8sNamespace LowCardinality(String) MATERIALIZED ResourceAttributes['k8s.namespace.name'],
    HttpStatus   UInt16 MATERIALIZED toUInt16OrZero(LogAttributes['http.status_code']),

    INDEX idx_body     Body    TYPE text(tokenizer = splitByNonAlpha),
    INDEX idx_trace_id TraceId TYPE bloom_filter(0.001) GRANULARITY 1
)
ENGINE = ReplicatedMergeTree('/clickhouse/tables/{shard}/{database}/{table}', '{replica}')
PARTITION BY toDate(Timestamp)
ORDER BY (ServiceName, SeverityText, toUnixTimestamp(Timestamp), TraceId)
TTL toDateTime(Timestamp) + INTERVAL 7 DAY TO VOLUME 'cold',
    toDateTime(Timestamp) + INTERVAL 365 DAY DELETE
SETTINGS storage_policy = 'hot_cold',
         ttl_only_drop_parts = 1;

CREATE TABLE otel.otel_logs ON CLUSTER logs AS otel.otel_logs_local
ENGINE = Distributed(logs, otel, otel_logs_local, rand());
Why each choice:
ORDER BY (ServiceName, SeverityText, time, …): the sort key doubles as the primary index. Put low-cardinality columns you always filter on first. A query forServiceName = 'checkout' AND SeverityText = 'ERROR'then skips most of the table without touching it. Order also drives compression, because identical service and severity values end up in long runs.PARTITION BY toDate(Timestamp): one partition per day. It’s coarse enough not to create thousands of parts, and it means retention can drop whole days.LowCardinality(String)for service, severity and attribute keys: dictionary-encoded, so it’s smaller and faster to filter.- Codecs:
Delta + ZSTDfor timestamps (consecutive values differ by tiny amounts) andZSTDfor everything else. ZSTD is the recommended general-purpose codec for log data. Mapfor attributes, materialized columns for hot keys: a Map is flexible, but readingLogAttributes['x']reads the whole map column. If dashboards filter on namespace or HTTP status all day, promote those keys to real columns. Map values are strings, hencetoUInt16OrZero.textindex onBody: an inverted index over tokens of the message, split on non-alphanumeric characters. It replaces the oldertokenbf_v1/ngrambf_v1bloom-filter skip indexes, which ClickHouse no longer recommends for this.Distributed(…, rand()): spreads inserts evenly. If you want all logs of a trace on one shard, shard bycityHash64(TraceId)instead.
The
textindex is GA from ClickHouse 26.2. On older versions it was experimental/beta and gated behind a setting, so check the docs for your exact version before relying on it. Adding it to an existing table withALTER TABLE … ADD INDEXonly covers new parts until you runMATERIALIZE INDEX.
Storage tiering: hot NVMe, cold S3, then gone
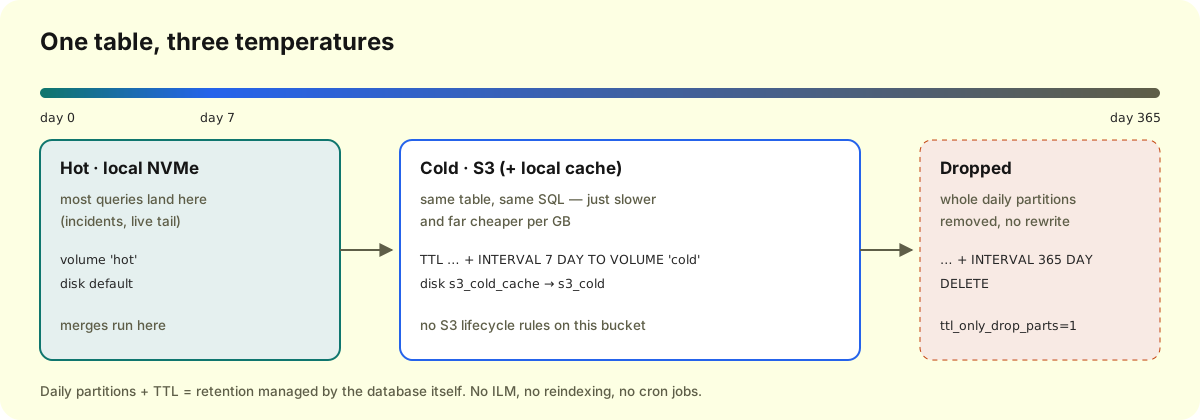
The storage policy, as a config file on every server (/etc/clickhouse-server/config.d/storage.xml):
<clickhouse>
  <storage_configuration>
    <disks>
      <s3_cold>
        <type>s3</type>
        <endpoint>https://my-logs-cold.s3.ap-southeast-1.amazonaws.com/{shard}/{replica}/</endpoint>
        <use_environment_credentials>true</use_environment_credentials>
        <metadata_path>/var/lib/clickhouse/disks/s3_cold/</metadata_path>
      </s3_cold>
      <s3_cold_cache>
        <type>cache</type>
        <disk>s3_cold</disk>
        <path>/var/lib/clickhouse/disks/s3_cold_cache/</path>
        <max_size>200Gi</max_size>
      </s3_cold_cache>
    </disks>
    <policies>
      <hot_cold>
        <volumes>
          <hot><disk>default</disk></hot>
          <cold><disk>s3_cold_cache</disk></cold>
        </volumes>
      </hot_cold>
    </policies>
  </storage_configuration>
</clickhouse>use_environment_credentialslets ClickHouse use the pod’s or instance’s IAM role, so no keys go in the config. On EKS that’s Pod Identity or IRSA.- The cache disk keeps recently read S3 data on local disk, so a second query over the same “last month” window doesn’t pay S3 latency again.
- Don’t put S3 lifecycle rules on this bucket that expire or transition objects. ClickHouse tracks every object in its metadata, and an object deleted behind its back is a corrupted part. Let the
TTL … DELETEclause do the deleting. ttl_only_drop_parts = 1makes expiry drop whole parts instead of rewriting them row by row. Combined with daily partitions, deleting day 366 becomes a metadata operation.
The pipeline with Vector
The aggregator, which reads from Kafka and writes to ClickHouse:
sources:
  kafka_logs:
    type: kafka
    bootstrap_servers: "b-1.logs.xxxx.kafka.ap-southeast-1.amazonaws.com:9096"
    group_id: vector-clickhouse
    topics: ["logs.raw"]
    auto_offset_reset: earliest
    decoding:
      codec: json
    sasl:
      enabled: true
      mechanism: SCRAM-SHA-512
      username: "${KAFKA_USER}"
      password: "${KAFKA_PASSWORD}"
    tls:
      enabled: true

transforms:
  shape:
    type: remap
    inputs: ["kafka_logs"]
    source: |
      body = string(.message) ?? encode_json(.message)
      # mask obvious secrets before they are stored for a year
      body = redact(body, filters: [r'(?i)(password|token|secret)=\S+'])
      # build a fresh event: only schema columns leave the aggregator
      . = compact({
        "Timestamp": .timestamp,
        "ServiceName": .kubernetes.pod_labels."app.kubernetes.io/name" || .kubernetes.container_name || "unknown",
        "SeverityText": upcase(string(.level) ?? "INFO"),
        "TraceId": .trace_id,
        "Body": body,
        "ResourceAttributes": {
          "k8s.namespace.name": .kubernetes.pod_namespace,
          "k8s.pod.name": .kubernetes.pod_name,
          "k8s.node.name": .kubernetes.pod_node_name
        }
      })

sinks:
  clickhouse:
    type: clickhouse
    inputs: ["shape"]
    endpoint: "http://clickhouse-logs.logging.svc:8123"
    database: otel
    table: otel_logs
    format: json_each_row
    compression: zstd
    skip_unknown_fields: true
    date_time_best_effort: true
    auth:
      strategy: basic
      user: vector
      password: "${CLICKHOUSE_PASSWORD}"
    batch:
      max_bytes: 20000000   # ~20 MB per insert
      timeout_secs: 5
    buffer:
      type: disk
      max_size: 10737418240 # 10 GiB on the aggregator's PVC
      when_full: block
    acknowledgements:
      enabled: true
What matters here:
- Batch size is everything. ClickHouse wants a few large inserts, not thousands of tiny ones. Every insert creates a part, and too many small parts end in the famous
Too many partserror. Vector’s defaultbatch.max_bytesis 10 MB with a 1-second timeout. Raising the timeout to a few seconds is usually fine for logs. acknowledgements.enabled: trueplus the Kafka source means offsets are committed only after ClickHouse accepts the batch. If the aggregator crashes, Kafka redelivers.- Disk buffer with
when_full: blockapplies back-pressure to Kafka consumption instead of dropping events. - Async inserts (
query_settings.async_insert_settings.enabled) are for the opposite situation: many clients each sending small batches, with ClickHouse doing the batching server-side. With a few aggregators already sending 10–20 MB batches, you don’t need them. skip_unknown_fieldslets producers add fields without breaking inserts. Anything not in the schema is dropped, so put the important ones intoLogAttributes.
Querying
The 95% case: filter by service and time, then token search.
SELECT Timestamp, ServiceName, K8sNamespace, Body
FROM otel.otel_logs
WHERE ServiceName = 'checkout'
  AND Timestamp >= now() - INTERVAL 30 MINUTE
  AND hasAllTokens(Body, ['connection', 'refused'])
ORDER BY Timestamp DESC
LIMIT 200;
The text index is used by hasAnyTokens / hasAllTokens (the recommended functions), hasToken, = / IN, LIKE / match, startsWith / endsWith and map functions. It is not used for NOT LIKE / NOT IN, so negative filters scan.
Where ClickHouse leaves Elasticsearch behind is analytics in plain SQL:
-- error ratio per service per minute
SELECT toStartOfMinute(Timestamp) AS t,
       ServiceName,
       countIf(SeverityText = 'ERROR') / count() AS error_ratio
FROM otel.otel_logs
WHERE Timestamp >= now() - INTERVAL 3 HOUR
GROUP BY t, ServiceName
ORDER BY t;

-- top error "shapes": collapse numbers and ids so similar messages group together
SELECT replaceRegexpAll(Body, '[0-9a-f]{8,}|\\d+', '?') AS pattern,
       count() AS n,
       any(Body) AS example
FROM otel.otel_logs
WHERE SeverityText = 'ERROR' AND Timestamp >= now() - INTERVAL 1 DAY
GROUP BY pattern
ORDER BY n DESC
LIMIT 20;
To see how well the schema compresses, per column:
SELECT name,
       formatReadableSize(sum(data_compressed_bytes))   AS compressed,
       formatReadableSize(sum(data_uncompressed_bytes)) AS raw,
       round(sum(data_uncompressed_bytes) / sum(data_compressed_bytes), 1) AS ratio
FROM system.columns
WHERE database = 'otel' AND table = 'otel_logs_local'
GROUP BY name
ORDER BY sum(data_compressed_bytes) DESC;
Per-column sizes are only reported for wide parts. Tiny test tables use compact parts and show zeros, but production-sized parts are wide. Body will almost always be the biggest column. If one service logs huge, repetitive stack traces, that’s where the bytes go, and fixing the logging is cheaper than any codec.
Multi-region: logs stay home, queries travel
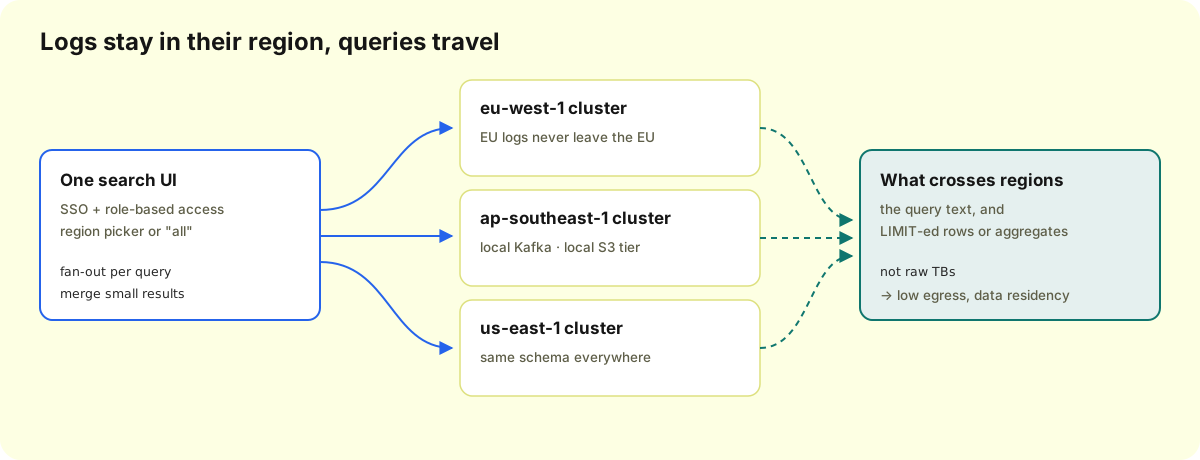
Shipping every log line to one central region is expensive (egress) and often not allowed (data residency). Instead, run the full pipeline per region, then give people one place to search:
- One cluster definition spanning regions: a
remote_serversentry, saylogs_global, lists every regional shard and its replicas. ADistributed(logs_global, otel, otel_logs_local)table on a small “query” node fans each query out. Every region filters and aggregates locally and sends back only the result. Setskip_unavailable_shards = 1for this table’s users so a region outage degrades the search instead of failing it. - Or let the UI do it: HyperDX and Grafana can hold one data source per region, so users pick a region or query them side by side.
- Access control: put the UI behind SSO and map groups to ClickHouse users or roles with row policies (for example
ServiceName IN (…)per team) and read-only settings profiles withmax_execution_timeandmax_memory_usage. One person’sSELECT *over a year shouldn’t take down the cluster for everyone.
Migrating without a big bang
- Dual-write. Add the ClickHouse sink next to the existing Elasticsearch sink in Vector (or Logstash/Fluent Bit). Both receive the same stream from Kafka using different consumer groups.
- Validate. Compare counts per service per hour between the two systems. Recreate the top dashboards and alerts. Have on-call use the new UI during a real incident or two.
- Cut over reads. Point dashboards, alerts and runbooks to ClickHouse. Keep Elasticsearch read-only.
- Let Elasticsearch age out. Stop the ES sink and let its existing retention expire, or snapshot it to S3 if compliance needs it. Backfilling history into ClickHouse is rarely worth the effort.
Gotchas
Too many parts: almost always small inserts. Look atsystem.partsper partition and increase batch size or timeout. Don’t “fix” it by raising the limit.- A wrong
ORDER BYis expensive to fix. Changing it means a new table and a copy. Look at real query filters before you pick it. - Map key explosion: if a producer puts request IDs or user IDs into attribute keys, the Map column becomes unbounded. Normalize in the Vector transform.
- No relevance, no fuzzy:
Body LIKE '%timeot%'won’t find “timeout”. Users coming from Kibana should expect exact token search. - Negative filters don’t use the text index (
NOT LIKE,NOT IN). Narrow by service and time first. - Deletes are not free. “Delete this user’s logs” means lightweight
DELETEor mutations, and those are expensive at this scale. Prefer masking at ingest and keep retention as your primary deletion tool. - Keeper is critical. Run it on dedicated nodes (3 or 5), spread across zones, with fast disks. If Keeper loses quorum, replicated tables go read-only.
- Huge parts: a single part above ~4.29 billion rows falls back to brute force for the text index. Daily partitions per shard normally keep you well below that.
- Long-running queries pin parts: a query holds a reference to every part it may read, so old parts can’t be deleted until it ends, including the local copies of parts TTL has moved to S3. Alert on cancelled queries that are still running. See the production incident below.
From production: the stuck query that held 1.1 TiB
Everything above is the design. This is what it looks like when part of it misbehaves. The cluster is the one from this article: 4 shards × 2 replicas, new data on local SSD, and a TTL rule that moves parts to S3 about seven days after their newest row.
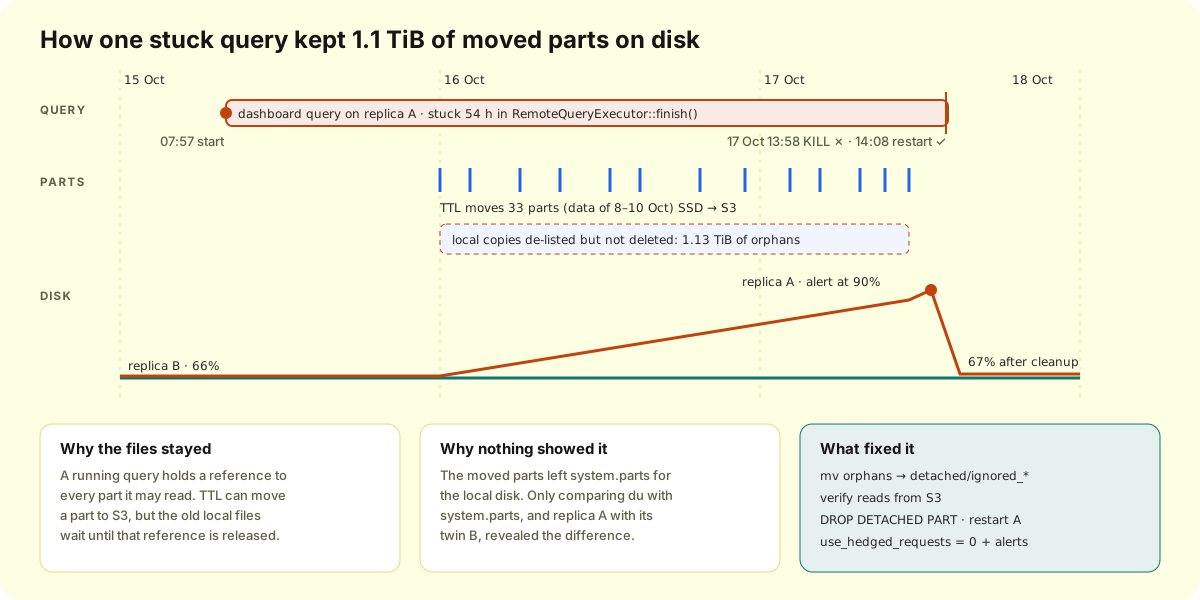
The symptom. On 17 October a disk alert fired: one replica (A) was at 90% (5.68 TiB used). Its twin in the same shard (B) was at 66%. system.disks showed the other seven replicas between 4.45 and 4.59 TiB, and A at 5.66 TiB.
Finding the extra bytes. A and B are copies of each other, so whatever differs is garbage. Active parts were identical, byte for byte. Inactive parts, detached parts and the S3 cache together explained only about 67 GiB. Over a terabyte was invisible to every system table. du pointed at one table, the biggest log table: 4.2 T on A against 3.0 T on B. Comparing the part directories on disk with what ClickHouse knows about found them:
cd <local-disk-path>/store/<prefix>/<table-uuid>
ls -1 | grep -E '^[0-9]{8}_' | sort > /tmp/disk.txt
clickhouse-client -q "SELECT name FROM system.parts
  WHERE database='<db>' AND table='<table>' AND disk_name='<local_disk>'" | sort > /tmp/ch.txt
comm -23 /tmp/disk.txt /tmp/ch.txt   # on disk, unknown to ClickHouse
A had 33 directories that weren’t in system.parts for the local disk: 1,158.69 GiB, all from the 8–10 October partitions. B had none. All 33 were active parts that now lived on the S3 disk. system.part_log showed a successful MovePart for each on 16 or 17 October, and no RemovePart. TTL had moved them to S3 and the local copies had simply stayed.
The cause. ClickHouse deletes a part’s files only when nothing references the part any more. On A, inactive parts that had expired at 07:58 on 15 October were still there with refcount = 2. On B they disappeared within minutes. system.processes showed what was holding them: a dashboard query that had been running for 194,158 seconds (about 54 hours) and had read only 3.1 million rows. system.stack_trace placed it in epoll inside RemoteQueryExecutor::finish(), waiting on a hedged connection to another replica for a reply that never came. A was logging many Broken pipe errors to other replicas at the time, so a half-dead connection is the likely trigger. That part is not proven.
A running query holds a reference to every part it might read. Parts merged after the query started piled up as inactive parts (291 parts, ~88 GiB, against 175 parts and 6.5 GiB on B). Then TTL moved 33 big parts to S3: ClickHouse removed the local copies from its part list but couldn’t delete the files. That’s the 1.13 TiB no system table showed. The partitions are named after the data’s date, not the move date, which is why a query from 15 October pinned data from 8–10 October: those parts were still on SSD that morning and moved a week after their newest row. Without the restart, every later day would have become an orphan as its move came due.
Two safety nets that didn’t catch it. KILL QUERY set is_cancelled = 1, but a thread blocked in epoll never checks that flag, so the query kept running. The dashboard user’s profile already had max_execution_time = 60, but that limit is checked while the pipeline processes data, and this query had stopped processing long before.
Cleanup without losing data. The orphans were removed before restarting: that freed space immediately, and nobody wanted to find out on production whether a table loads cleanly when a part exists on both SSD and S3.
-
Rebuild the orphan list and confirm each of the 33 parts is active on the S3 disk with its metadata there.
-
Move, don’t delete. Same filesystem, so it’s instant and easy to undo:
while read p; do mv "$p" "detached/ignored_$p"; done < /tmp/orphan.txt -
ClickHouse now sees them in
system.detached_parts(1.13 TiB). Check that the three affected days still read correctly from S3, then drop them through ClickHouse:ALTER TABLE <db>.<table> DROP DETACHED PART 'ignored_<name>' SETTINGS allow_drop_detached = 1; -
A went from 5.66 TiB to 4.6 TiB (90% → 67%).
KILL QUERY … ASYNCstill didn’t stop the query, so after saving the stack trace and checking that B was healthy (is_readonly = 0, no replication lag, no new orphans), A’s pod was restarted. It came back on the same volume, caught up on replication and cleaned up its old inactive parts by itself.
What changes. The disk alert did its job, but only at 90%, two days after the cause. The plan is to catch the cause instead. First, stop dashboard queries from taking the code path that hung. With two replicas per shard, hedged requests buy almost nothing:
profiles:
  <dashboard_profile>:
    max_execution_time: 60
    use_hedged_requests: 0
Then alert on the conditions that came before the full disk:
| Alert | Fires when | Severity |
|---|---|---|
| Cancelled query still running | is_cancelled = 1 and elapsed > 600 |
Critical |
| Query running too long | elapsed > 3600 on any replica |
Warning |
| Inactive parts not removed | an inactive part’s remove_time is older than 1 hour |
Warning |
| Space ClickHouse doesn’t track | disk used minus bytes_on_disk of parts exceeds 200 GiB |
Warning |
| Replicas drifting apart | used space differs by more than 10% within a shard | Warning |
The first one would have caught this incident. The queries behind the first three:
-- cancelled-but-running and long-running queries
SELECT hostName() AS host, query_id, user, elapsed, is_cancelled
FROM clusterAllReplicas('<cluster>', system.processes)
WHERE elapsed > 3600 OR (is_cancelled AND elapsed > 600);

-- inactive parts that should have been removed long ago
SELECT hostName() AS host, database, table, count() AS parts, min(remove_time) AS oldest
FROM clusterAllReplicas('<cluster>', system.parts)
WHERE NOT active AND remove_time < now() - INTERVAL 1 HOUR
GROUP BY host, database, table;
For untracked space, run this on each replica and set the threshold above the size of the local cache:
SELECT
  (SELECT total_space - free_space FROM system.disks WHERE name = '<local_disk>')
  - (SELECT sum(bytes_on_disk) FROM system.parts WHERE disk_name = '<local_disk>') AS untracked_bytes;
Lessons.
- Compare a replica with its twin. They should be identical, so any difference is where the problem is.
- System tables only show what ClickHouse still manages. Here the garbage was exactly what it had stopped managing, so
duhad to be compared withsystem.partsby hand. - A query that never finishes costs more than CPU. It pins old parts, and with TTL moves that can mean a second copy of everything that was moved.
KILLdoesn’t always work. A cancelled query still alive after ten minutes should page someone.
Two questions are still open: whether this hang is a known ClickHouse bug (to be searched in the issue tracker by stack trace, and reported if not), and whether the client overrode max_execution_time for that query (to be checked in system.query_log).
Wrap-up
Logs are a columnar, time-series problem that we’ve been solving with a search engine. Move them into ClickHouse with:
- an OTel-shaped schema whose
ORDER BYmatches how you filter, - the
textindex for token search, - Vector and Kafka for durable, batched ingestion, and
- TTL tiering to S3.
You end up with longer retention, real SQL and a much smaller bill. Keep Elasticsearch, or OpenSearch, for the places that actually need ranked full-text search.
Sources
- ClickStack overview (ClickHouse, HyperDX, OTel collector): https://clickhouse.com/docs/use-cases/observability/clickstack/overview
- Observability schema design: https://clickhouse.com/docs/use-cases/observability/schema-design
- Full-text search with text indexes: https://clickhouse.com/docs/engines/table-engines/mergetree-family/invertedindexes
- Separation of storage and compute (S3 disks, cache): https://clickhouse.com/docs/guides/separation-storage-compute
- MergeTree TTL and
ttl_only_drop_parts: https://clickhouse.com/docs/engines/table-engines/mergetree-family/mergetree#table_engine-mergetree-ttl - Vector ClickHouse sink: https://vector.dev/docs/reference/configuration/sinks/clickhouse/
- Vector Kafka source: https://vector.dev/docs/reference/configuration/sources/kafka/
- ClickHouse
system.parts: https://clickhouse.com/docs/operations/system-tables/parts - ClickHouse
system.part_log: https://clickhouse.com/docs/operations/system-tables/part_log ALTER TABLE … DROP DETACHED PART: https://clickhouse.com/docs/sql-reference/statements/alter/partition#drop-detached-partitionpartKILL QUERY: https://clickhouse.com/docs/sql-reference/statements/killuse_hedged_requestssetting: https://clickhouse.com/docs/operations/settings/settings#use_hedged_requests
Comments